I′mTemitope Esther
A data analyst and Data Visualization Analyst

Power BI

My SQL


Excel
Python
About me
About me

I love
storytelling
Data visualization
Music
Money
Years
of Experience
7+
Projects Completed
I'm Bisiriyu Esther Temitope, I am a detail-oriented and results-driven Data Analyst with a background in finance and a strong proficiency in data analysis, business intelligence, and data visualization.
Projects
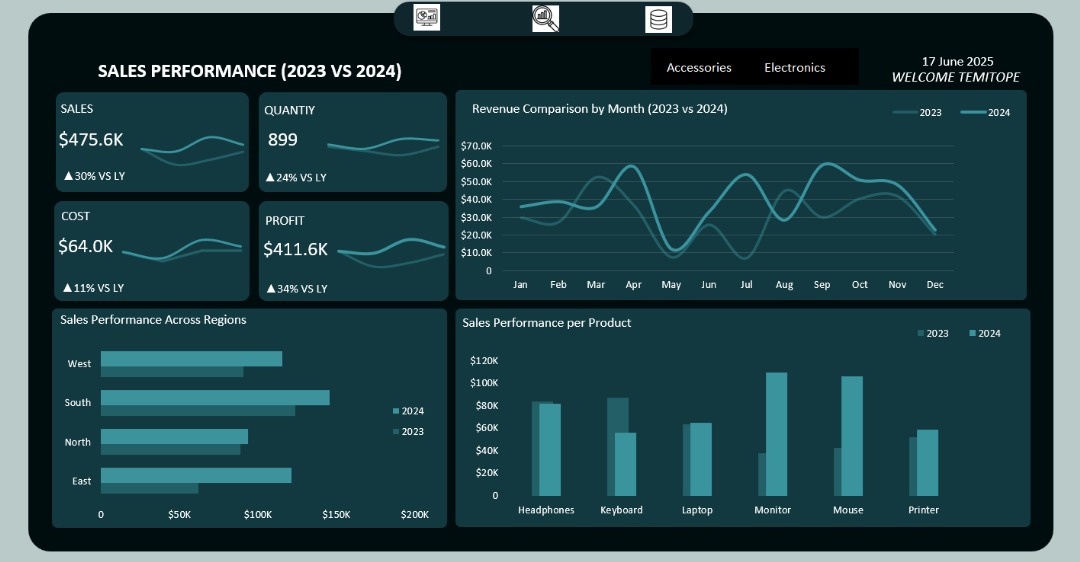
Sales Performance Dashboard (2023 vs 2024)
Technologies Used
Microsoft Excel
Pivot tables
Description:I designed this interactive Excel dashboard to analyze year-over-year sales data, revealing a 30% increase in revenue ($475.6K) and a 34% rise in profit ($411.6K) in 2024. The dashboard breaks down sales by region, product, and month—highlighting strong growth in the South region and top-performing products like Monitors and Mouse. It also includes cost analysis, which rose 11% YoY, and provides actionable recommendations to improve underperforming areas and optimize cost efficiency.
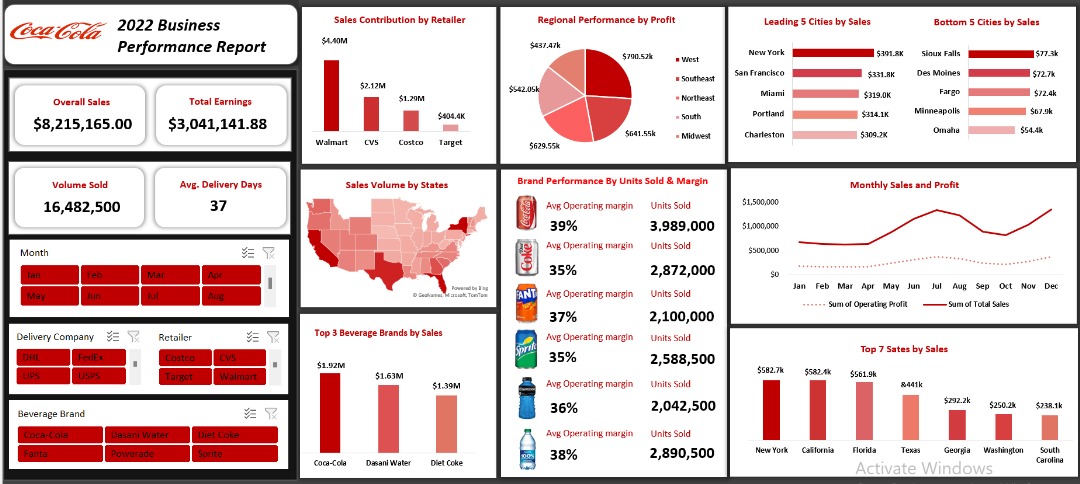
Coca Cola 2022 Business Performance Report
Technologies Used
Microsoft Excel
Pivot tables
Description:I analyzed Coca-Cola’s 2022 U.S. sales and operating profit using Excel, covering retailers, regions, states, and cities. The dashboard revealed key insights, such as $8.2M in total sales, $3.04M earnings, and Walmart as the top retailer with $4M sales. Coca-Cola led beverage sales at $1.92M with 3.99M units sold. This project delivered clear visualizations and actionable recommendations to support business performance.
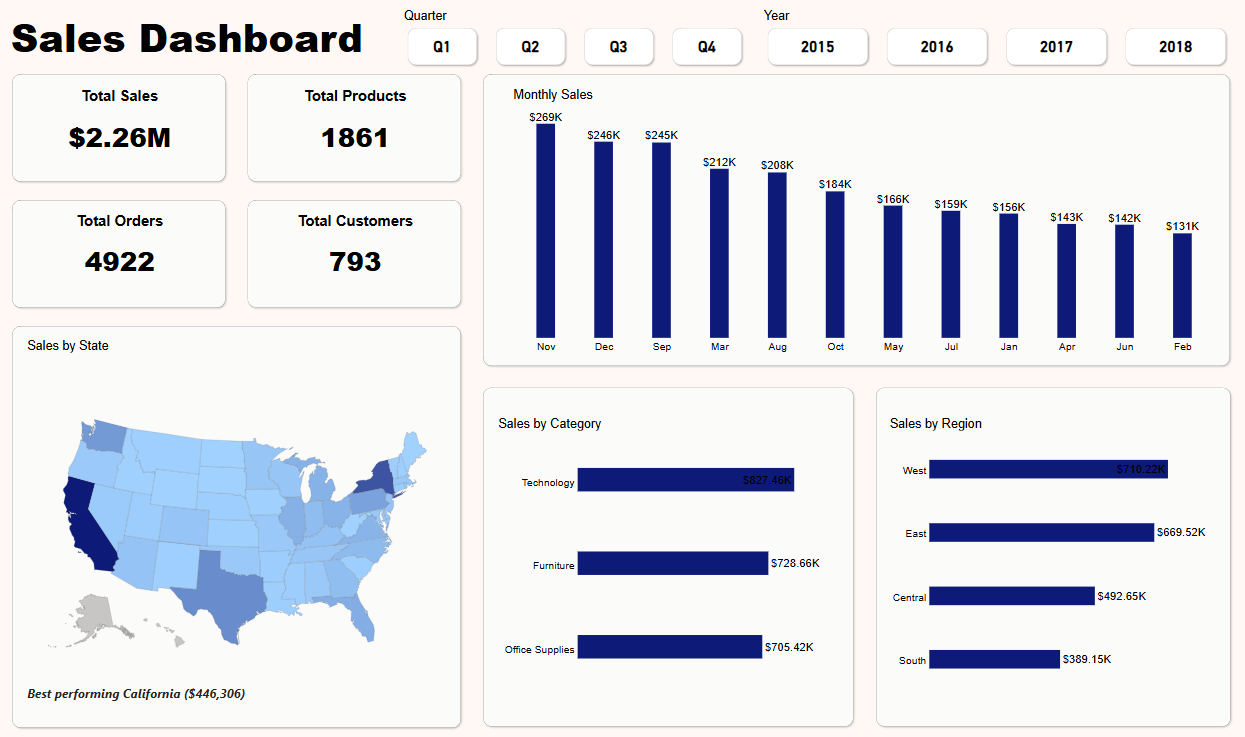
Sales Performance
Technologies Used
Power Bi
DAX
Power Query
Description: I designed an interactive Power BI dashboard to visualize and analyze sales performance across different dimensions. Users can explore trends using dynamic filters for quarter and year, allowing for a deeper understanding of key metrics like total sales, orders, customers, and regional performance.
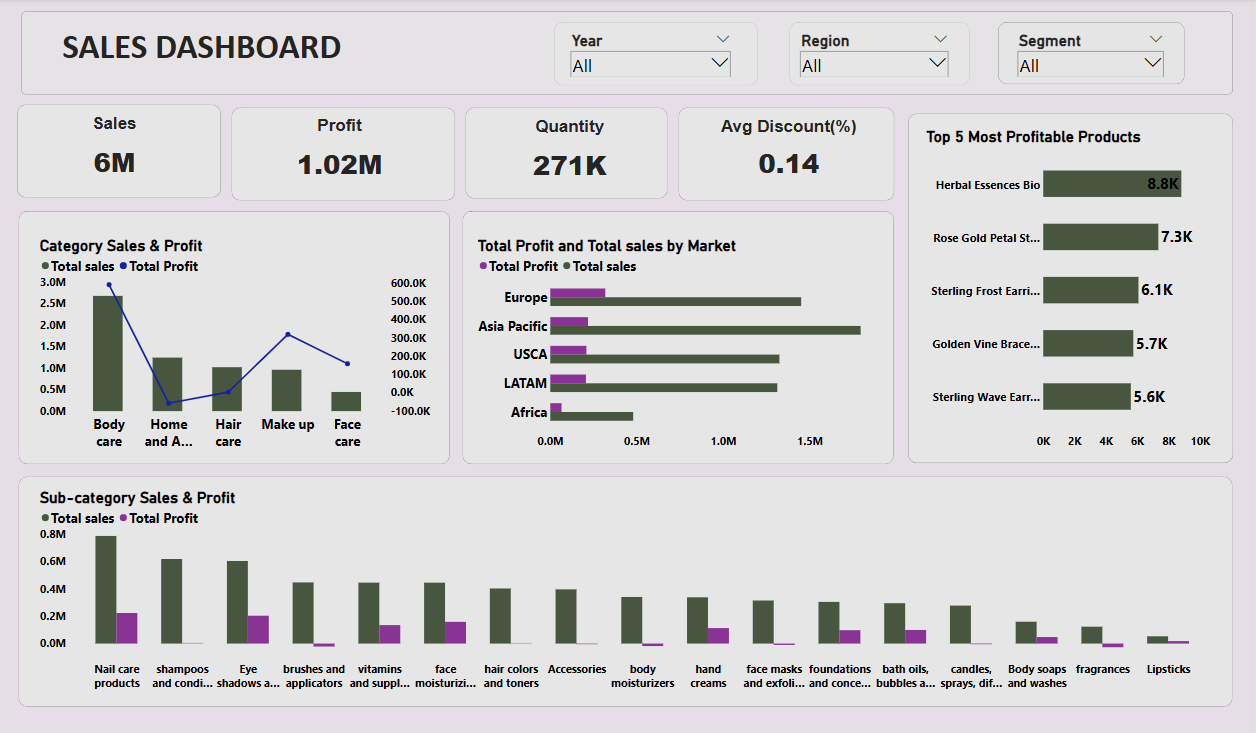
Beauty Store
Technologies Used
Python
Power Bi
DAX
Description: I developed a Power BI dashboard to track and analyze sales performance for a beauty store, focusing on metrics such as total sales, profit, order volume, and customer segments.
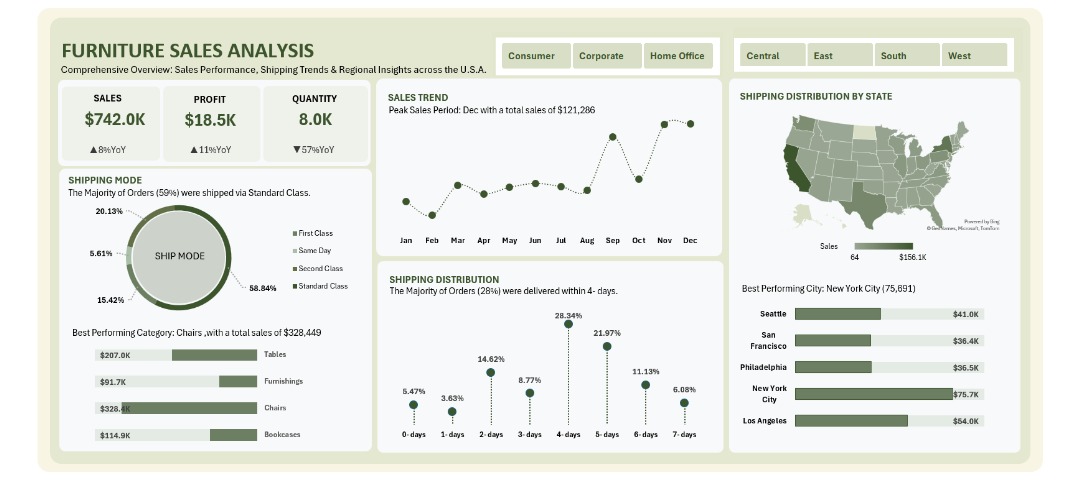
Furniture Sales Analysis
Technologies Used
Microsoft Excel
Power Query
Pivot Tables
Description: Furniture Sales Analysis I Designed a dynamic Excel dashboard to analyze 9,994+ U.S. furniture orders totaling over $742K in revenue. Used pivot tables, charts, slicers, and conditional formatting to uncover key business trends. Insights included peak sales in December ($121K), top-performing category (Chairs: $328K), and highest-grossing city (New York City: $75.7K). The dashboard enables strategic decision-making across product lines, regions, and shipping performance.

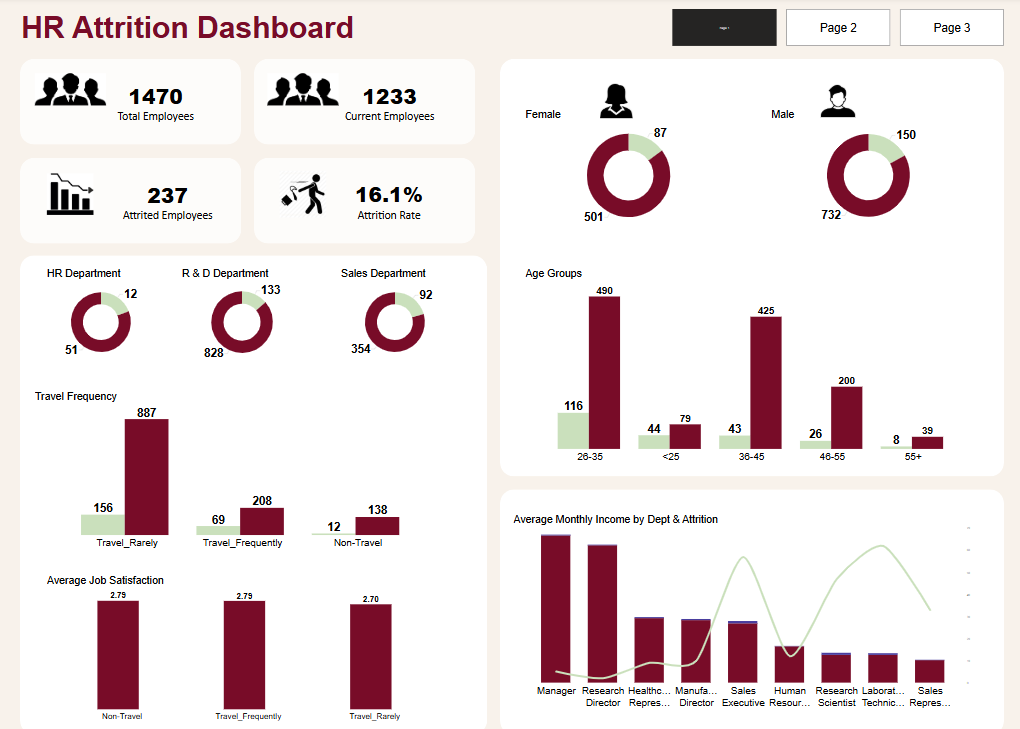
Car Insurance Claims Analysis
Technologies Used
Power Bi
DAX
Power Query
Description: An interactive Power BI dashboard exploring trends in car insurance claims. The project includes data cleaning with Power Query, age grouping, and custom measures to highlight claim frequency, cost patterns, and policyholder demographics.
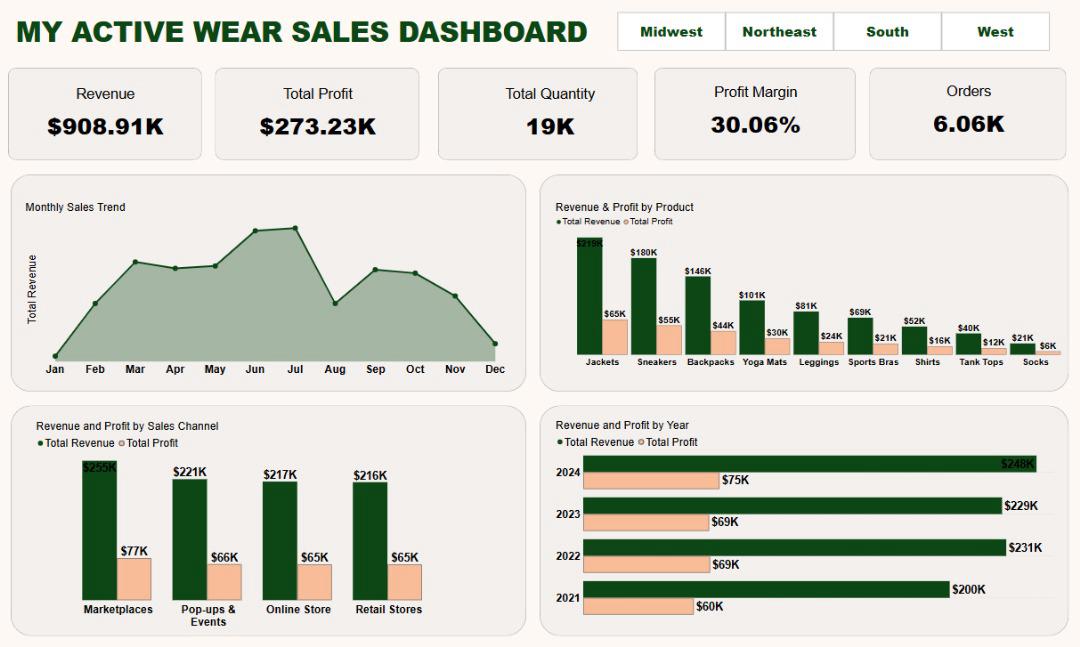
Active Wear Sales
Technologies Used
Power Bi
DAX
Power Query
Description: I created a Power BI dashboard to analyze sales performance for an activewear company, focusing on key metrics such as total revenue, profit, order quantity, and profit margin.
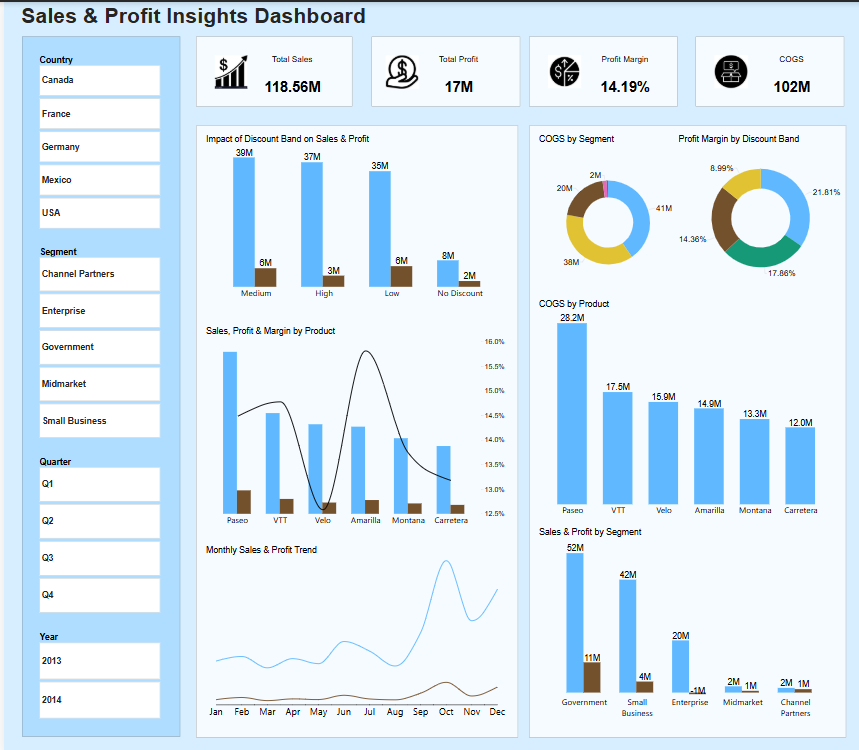
Sales And Profit Insight
Technologies Used
Excel
Power Bi
DAX
SQL
Description: I performed exploratory data analysis using SQL and built an interactive Power BI dashboard to visualize sales, profit, COGS, and discount impact across countries, segments, and products.
Experiences

Zenith Bank Plc
LA, Nigeria
2023 - Present
Executive Trainee (Operations Team member)
Process customer transactions, including deposits, withdrawals, and transfers, ensuring accuracy and efficiency.
Process customer transactions, including deposits, withdrawals, and transfers, ensuring accuracy and efficiency.
Uses Excel to Reconcile and balance cash drawers, ensuring zero discrepancies.
Deliver exceptional customer service while resolving transactional issues effectively.
Access ARM Pension
LA, Nigeria
2022 - 2023
NYSC Finance Intern
Assisted in preparing month-end financial reports and reconciling accounts to support financial decision-making
Posted journal entries and contributed to accurate financial record-keeping
Supported accounts receivable and payable functions to ensure timely payments and collections
Performed data entry and analysis, enhancing financial tracking efficiency
Automated financial reports to improve decision-making.
Education
2024 - 2025
Tech School
Tech Studio Academy
Diploma Data Analyst
Lagos State
2016 - 2021
University